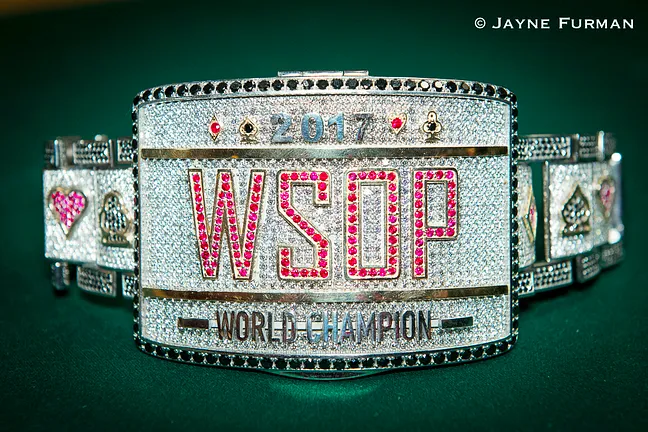
$8,150,000 Awaits the Winner in the Third Biggest Main Event Ever


Day 1c of the 2017 World Series of Poker Main Event has attracted 4,262 players, the largest in recent history. Together with the 795 that came to the Rio All Suite Hotel and Casino for Day 1a and the 2,164 that played yesterday on Day 1b, that makes for 7,221 total players. With that, the 2017 edition of the Main Event is officially the third biggest Main Event in the history of the WSOP. The event only attracted bigger fields in 2006 (Jamie Gold beat a field of 8,773) and 2010 (Jonathan Duhamel beat a field of 7,319).
With the numbers now official, the payouts have been confirmed as well. The winner of the 2017 World Series of Poker Main Event takes home $8,150,000. All nine finalists are guaranteed to make $1,000,000, and a total of 1,084 players get in the money. The min-cash is, again, $15,000. A complete breakdown of the payout:
| Position | Prize | POY Points |
|---|---|---|
| 1st | $8,150,000 | 433.2 |
| 2nd | $4,700,000 | 360.6 |
| 3rd | $3,500,000 | 326.8 |
| 4th | $2,600,000 | 296.0 |
| 5th | $2,000,000 | 271.2 |
| 6th | $1,675,000 | 255.7 |
| 7th | $1,425,000 | 242.3 |
| 8th | $1,200,000 | 228.8 |
| 9th | $1,000,000 | 215.3 |
| 10th | $825,001 | 201.9 |
| 11th | $675,000 | 188.9 |
| 12th-13th | $535,000 | 174.8 |
| 14th-15th | $450,000 | 165.0 |
| 16th-18th | $340,000 | 150.3 |
| 19th-27th | $263,532 | 138.0 |
| 28th-36th | $214,913 | 129.0 |
| 37th-45th | $176,399 | 120.7 |
| 46th-54th | $145,733 | 113.3 |
| 55th-63rd | $121,188 | 106.5 |
| 64th-72nd | $101,444 | 100.4 |
| 73rd-81st | $85,482 | 94.8 |
| 82nd-90th | $72,514 | 89.8 |
| 91st-99th | $61,929 | 85.2 |
| 100th-162nd | $53,247 | 81.0 |
| 163rd-225th | $46,096 | 77.2 |
| 226th-288th | $40,181 | 73.7 |
| 289th-351st | $35,267 | 70.6 |
| 352nd-414th | $31,170 | 67.8 |
| 415th-477th | $27,743 | 65.2 |
| 478th-540th | $24,867 | 62.8 |
| 541st-603rd | $22,449 | 60.7 |
| 604th-666th | $20,411 | 58.8 |
| 667th-765th | $18,693 | 57.1 |
| 766th-864th | $17,243 | 55.6 |
| 865th-963rd | $16,024 | 54.3 |
| 964th-1084th | $15,000 | 53.1 |
Here's a breakdown of the numbers in recent years:
| Day 1a | Day 1b | Day 1c | Day 1d | Total | Prize Pool | |
|---|---|---|---|---|---|---|
| 2008 | 1,297 | 1,158 | 1,928 | 2,461 | 6,844 | $64,333,600 |
| 2009 | 1,116 | 873 | 1,696 | 2,809 | 6,494 | $61,043,600 |
| 2010 | 1,125 | 1,489 | 2,314 | 2,391 | 7,319 | $68,798,600 |
| 2011 | 897 | 985 | 2,181 | 2,802 | 6,865 | $64,531,000 |
| 2012 | 1,066 | 2,114 | 3,418 | - | 6,598 | $62,021,200 |
| 2013 | 943 | 1,942 | 3,467 | - | 6,352 | $59,708,800 |
| 2014 | 771 | 2,144 | 3,768 | - | 6,683 | $62,820,200 |
| 2015 | 741 | 1,716 | 3,963 | - | 6,420 | $60,348,000 |
| 2016 | 764 | 1,733 | 4,240 | - | 6,737 | $63,327,800 |
| 2017 | 795 | 2,164 | 4,262 | - | 7,221 | $67,877,400 |


